France’s 2026 Slowdown Has Yet to Meet the Test for Recession
- Cargo
- Economy
- Shipped
- Shipper
- Menzie Chinn
- Readers
- 758
French output slipped 0.1% in the third quarter, but the committee says the shallow decline and mixed indicators don’t yet establish a recession.
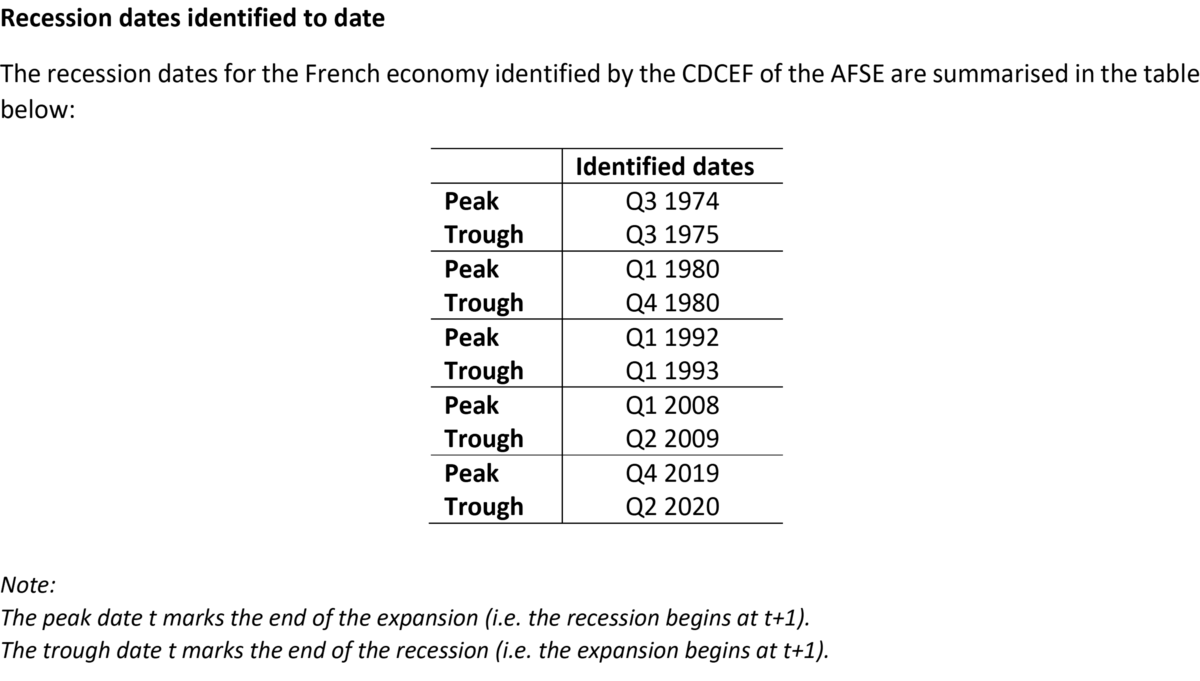
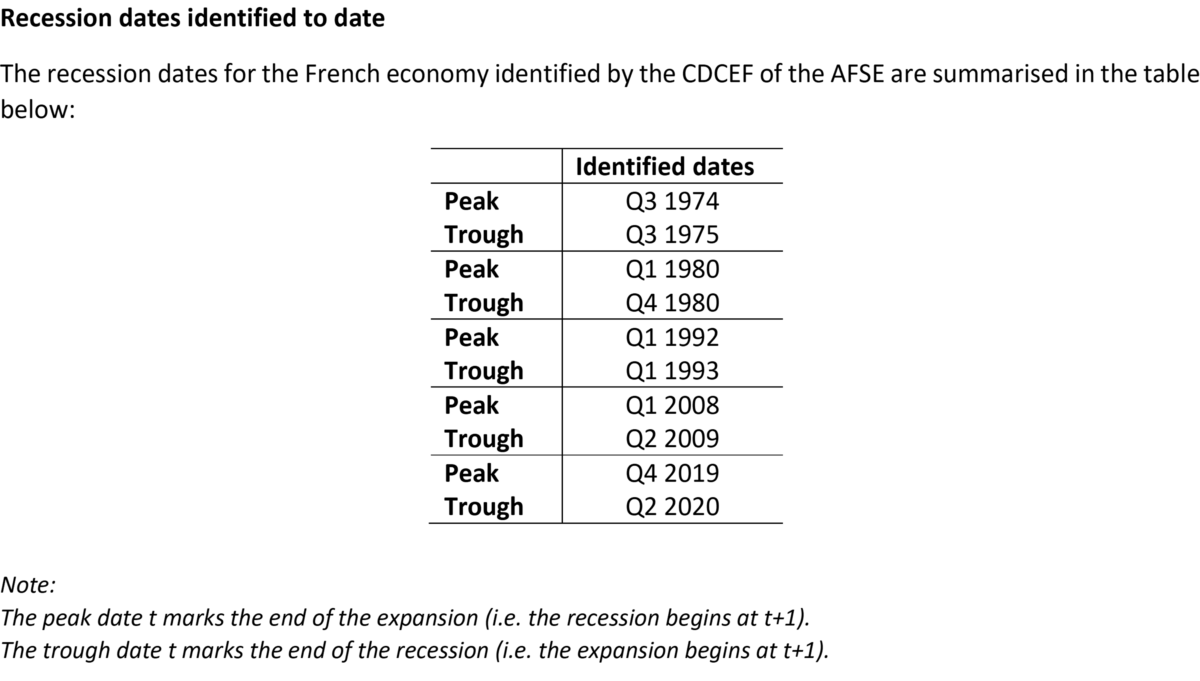
France’s economy has weakened, but the available figures don’t yet show the broad, sustained contraction needed to identify a recession. The French Business Cycle Dating Committee (CDCEF), part of the French Economic Association (AFSE), says the distinction matters: two negative quarterly GDP readings can flag trouble, but they don’t settle whether the economy has entered a recession.
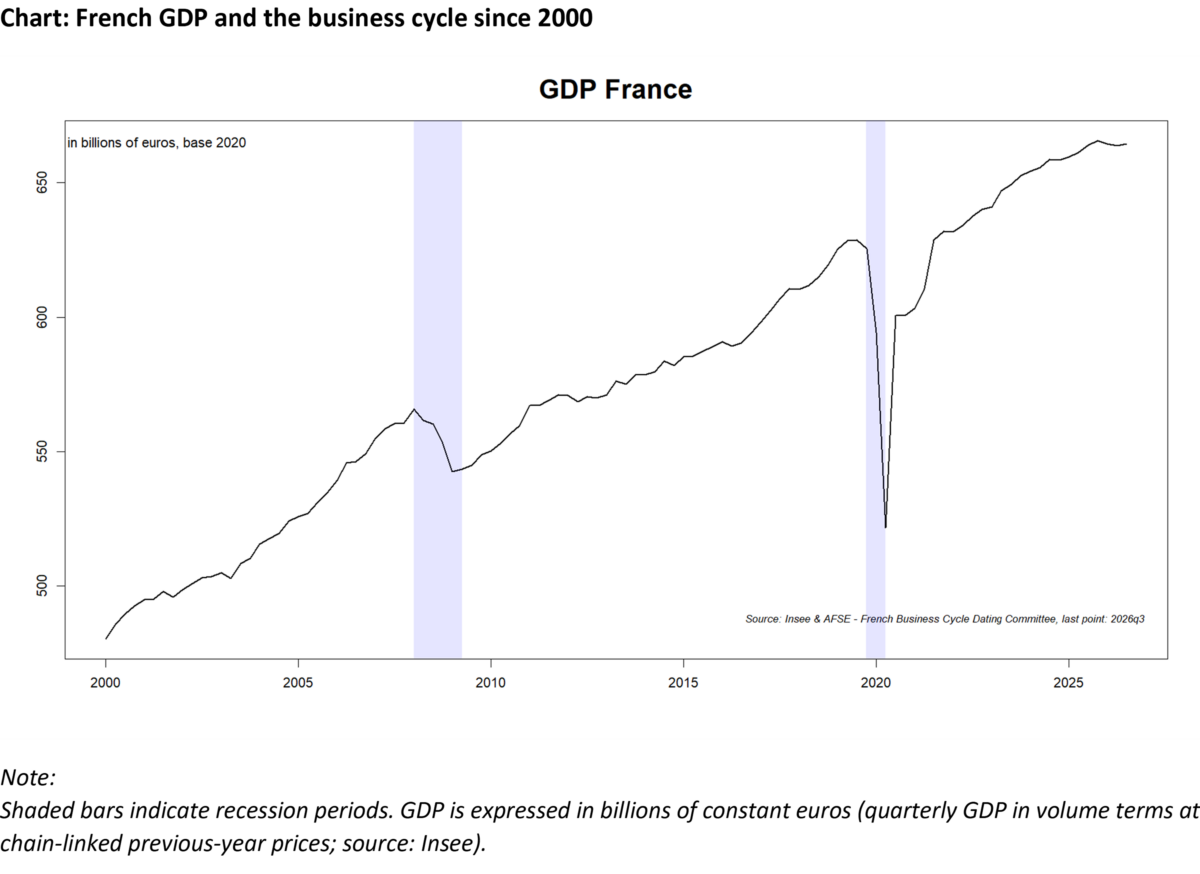
Figures from Insee put French GDP growth at −0.1% in the third quarter of 2026, following a 0.2% contraction in the first quarter and no growth in the second. Those results have prompted some commentators to describe the first three quarters as a “technical recession.” The committee’s assessment, communicated on 10/29/2026 by its chair, Laurent Ferrara, is more cautious: based on information currently available, it does not find sufficient evidence to date a recession.
Why two weak quarters aren’t enough
The committee’s approach considers three features of a downturn: its duration, depth and diffusion, known as the “3D’s” rule. In practice, that means looking beyond the headline GDP sequence to see how long the decline lasts, how much activity falls and whether weakness spreads across the economy. A short-lived or narrowly concentrated shock can produce disappointing aggregate figures without showing a broad business cycle contraction.
That distinction also helps explain why the committee waits before making a firm assessment. GDP estimates can change as new information becomes available. With growth readings for the first three quarters of 2026 close to zero, revisions could shift a negative estimate into positive territory. The committee says it generally allows several months to pass before reaching a reliable judgment. The current figures describe a fragile period, but their small size makes them especially sensitive to revision.
The committee’s method combines quantitative analysis, including econometric approaches, with expert judgment. Its aim is to establish a historical chronology of turning points, identifying the peaks and troughs that mark changes between declining and rising activity. It uses the business cycle definition also applied by the NBER in the United States and the CEPR for the euro area: periods of falling activity alternate with periods of rising activity.
A shallow aggregate decline, with mixed signals
GDP has fallen by around 0.3% cumulatively since the fourth quarter of 2025, according to the data available to the committee. That decline is modest beside the contractions it cites for earlier downturns: approximately 3% during the recession after the first oil shock of 1973, and 4% during the 2007–2008 financial crisis. The historical comparisons don’t determine whether a recession has occurred; they show why the current loss in output looks more like stagnation or an extended slowdown than a pronounced contraction.
Other indicators offer a mixed picture. Total employment stands at a stable, very high level of 30.5 million, while the capacity utilisation rate is holding at around 81%. Investment by non-financial corporations has been on a plateau since 2023q3, rather than showing a recent, sharp collapse. Hours worked have weakened: they are down 0.6% from their peak in 2024q3. Together, these measures point to strain in activity without a clear decline across every dimension the committee monitors.
Stable employment and capacity use do not erase the fall in GDP, and a flat investment measure can still signal weak momentum. But the contrast between falling output and relatively steady readings elsewhere is central to the committee’s caution. For employees, the employment figure is a sign of resilience so far; for businesses, the investment plateau and lower output suggest that activity has lost pace. The indicators could change, so none resolves the question on its own.
A sector shock complicates the reading
A sharp drop in agricultural value added has also weighed on the 2026 figures, following an exceptional summer drought. Insee records agricultural output over the production cycle, rather than assigning it only to the quarter when crops are harvested. Crop losses, particularly in maize, therefore led to downward revisions to estimates of agricultural output in both the first and second quarters.
This timing matters for interpreting the quarterly pattern. Revisions connected to one sector can alter how weak the overall economy appears across several quarters, even when the underlying cause is concentrated in agricultural production. The shock helps explain part of the slowdown, though it doesn’t by itself account for every indicator or establish how activity will develop next.
What would change the assessment
The committee says the present evidence does not support identifying a French recession over the first three quarters of 2026. It nevertheless describes activity as particularly sluggish and says its course warrants close monitoring. Its role is to identify and date turning points through a review of available evidence, not to forecast when they will occur.
A stronger case for recession would require the decline to persist, deepen and spread across more sectors. Further GDP revisions, changes in employment or hours worked, and broader shifts in business activity could all affect the assessment. The key question is whether the weak output readings remain shallow and uneven, or become a sustained contraction visible across a wider set of measures.
The committee was established in October 2020 under the AFSE to maintain a historical chronology of French business cycle turning points. Its methodology is described in a working paper available on the AFSE website and published in French in Revue Economique. The committee’s statement in French is available alongside its association profile.